I couldn’t have been more pleased with the response to my first annual reader survey. A total of 418 of you responded to my (lengthy) questionnaire, telling me your hopes and dreams (and, of course, your favorite recipes).
I want you to know that I read each and every one of your responses. And on the whole they were incredibly positive, I was literally grinning the whole time. Y’all were so kind and thoughtful (and thorough) with your answers. Honestly, I really couldn’t ask for better readers than you. Thank you all from the bottom of my heart, for essentially reinforcing that I’m doing something right.
I do want you to know (since some of you expressed concerns) that I have no plans to change this blog in any significant way. We’re going to keep making the food we want to eat, and, as you’ve made pretty clear, it’s the same kind of food you want to eat too. That said, your feedback will most definitely sit cozily in the back of my mind as I develop future content and features.
A few of you expressed interest in knowing the results of my recent reader survey, so I thought I’d whip up a fancy infographic (I say “whip up” which implies it was quick; this darn thing took me longer than 3 normal posts!) I’ve combined the survey answers with some broader demographic data (who paid attention in college Statistics class? This girl!) and the results really give you a clear picture of just who reads this little blog of mine.
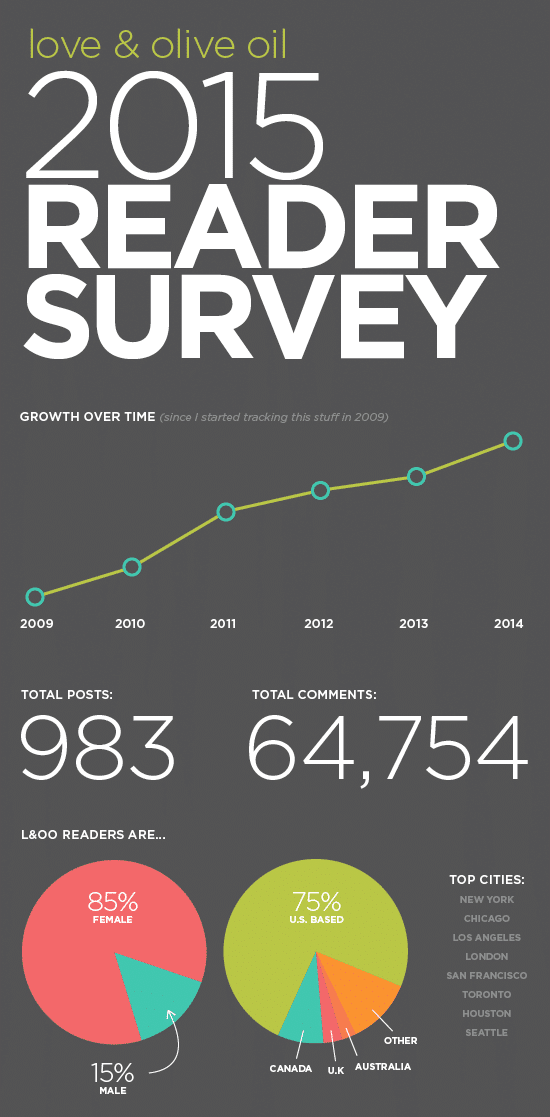
(Click through to see the full graphic!)

Well, that was fun! Let’s do it again next year, shall we? :)
Dang, teach me your infographic ways!!!!!
LOVE THIS. I’m studying Marketing right now and trying to design a good-looking presentation out of the MASSIVE amount of data we’ve collected for a consulting assignment has been a headache and a half. Taking inspiration from your lovely layout! Thanks for sharing your awesome results with us!
I am always so jealous of your mad design skillz. That’s one great looking infographic. XO your fellow type geek
I love this, Lindsay! So interesting to see the results of your survey. :D
“Man food” “Cat pictures”
Definitely!!!!! LOL
Love the way your presented your results. I am a new reader and definitely will keep coming back for more! Thank you. Thank you for keeping it real too.
So cool! I love that infographic. It’s awesome that so many of your readers have been clicking over here for several years!
Any plans to do some posts on photography? :)